
Denver-based full-stack technologist and lifelong maker who has spent decades building software, exploring data, tinkering with hardware, and helping developers succeed. My work spans UX/UI, web standards, application development, data analytics, AI/ML, and practical problem-solving — and I still love learning something new every day.
Documentation, samples, developer tooling, education, and DX strategy.
Modern UI/UX, Web Components, and standards-based client architecture.
APIs, backend services, automation tools, and production-ready systems.
Database design, real-time telemetry, data pipelines, and insight generation.
Model training, computer vision, inference pipelines, and applied ML tooling.
Sensor design, device integration, and real-time data flows.

A Raspberry Pi camera and custom-trained Watson model detect whether a garage door is open or closed. Combines ML, image processing, and IoT.

Every once in a while you need to roll your own. With a splash of SVG and helping hand from Stencil, you can create a custom chart as a web component.

Upload an audio file to S3, manage the details of an AWS Transcribe job, and download the results. Include code to clean up after yourself if you are so inclined.

In this post, we put aside the charting libraries, dive into some circle math, and discover that building lightweight custom charts is easier than you think.

A real-time telemetry demo using a drone, sensors, wireless links, and satellite uplink to stream flight-style data to the cloud, illustrating a modern "black box."

A reflection on how the classic Project Triangle applies to developer relations, exploring the trade-offs when building authentic developer communities.
When exporting SVG from Illustrator, individual tspan elements will be created for text blocks with font changes. The spans include coordinate attributes, preventing the natural flow of the text. This can create unwanted spacing between words. These attributes can be removed.
When building workflows, consider the pipeline pattern. This pattern is an array of step functions that leverage the same context object. The context is created with all the necessary keys, then passed to a step which may/not modify it, and then returns it. Repeat for each step.
Ran across an interesting tweak to the 1:1 meeting today. At the start of the meeting, each participant must ask one non-work-related question. Question can be vetoed. The 1:1 meeting is for the direct report, not the manager. This is a great way to set that framing.
This assistant is trained on my public work and resume.
This tool is helpful, but not perfect. For nuance or a real conversation, contact me.
Professional software development
Working remote as a technologist
Speaking/workshop engagements
Managed for DevRel programs
Supported via internal AI tooling
Directly mentored across career
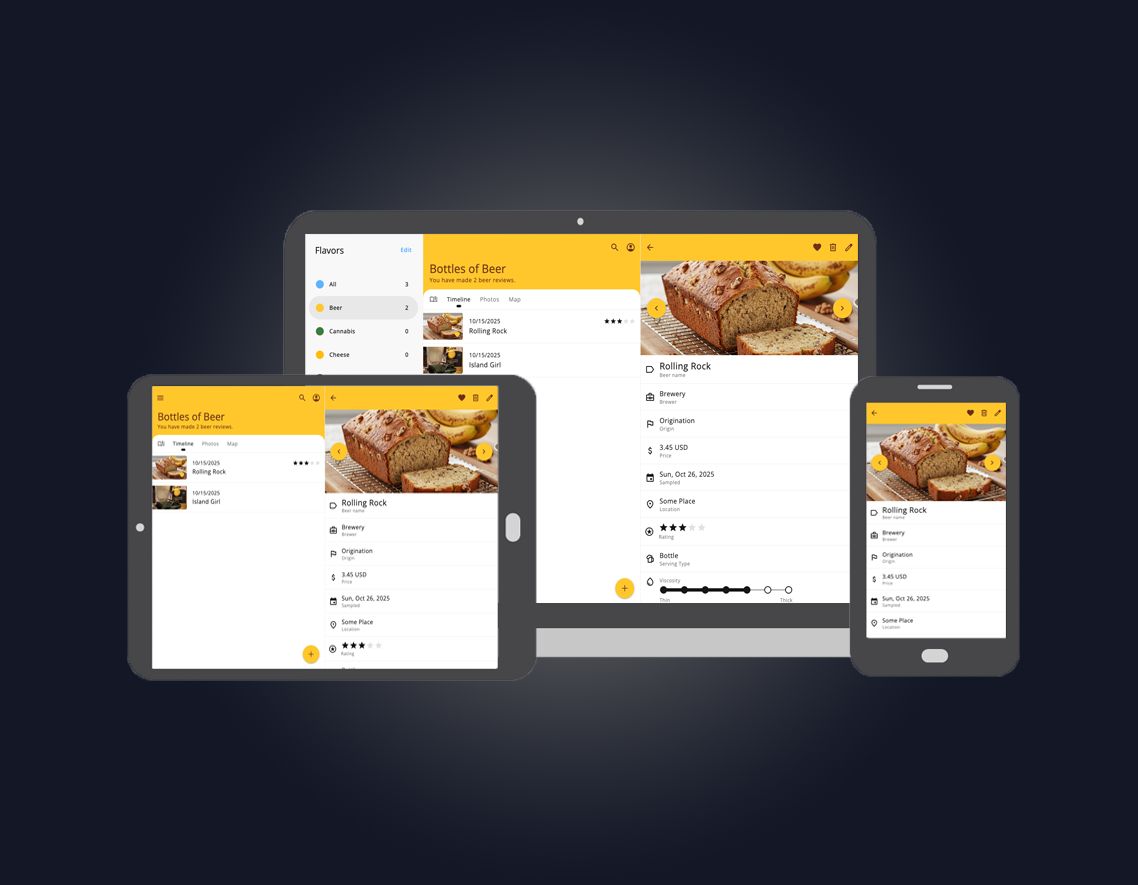
Developed for people with a mouth. Assists with palate development for people looking to improve their understanding of the foods they consume. From hobbyist to connoisseur. Robust data visualization, AI recommendations, and custom form controls.
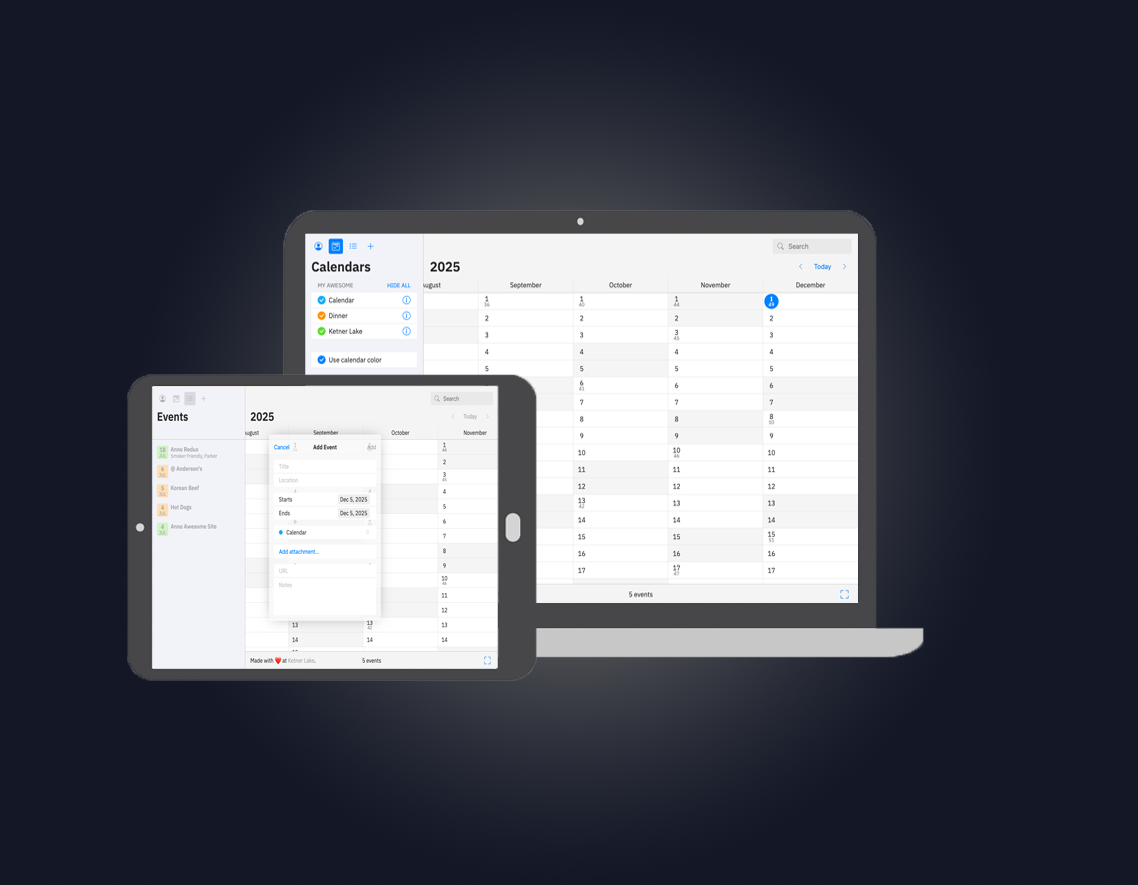
A comprehensive year-at-a-glance calendar. Built with Web Components, embracing a MacOS look and feel. Supports multiple calendars and limited sharing via cloud object storage and serverless integration.
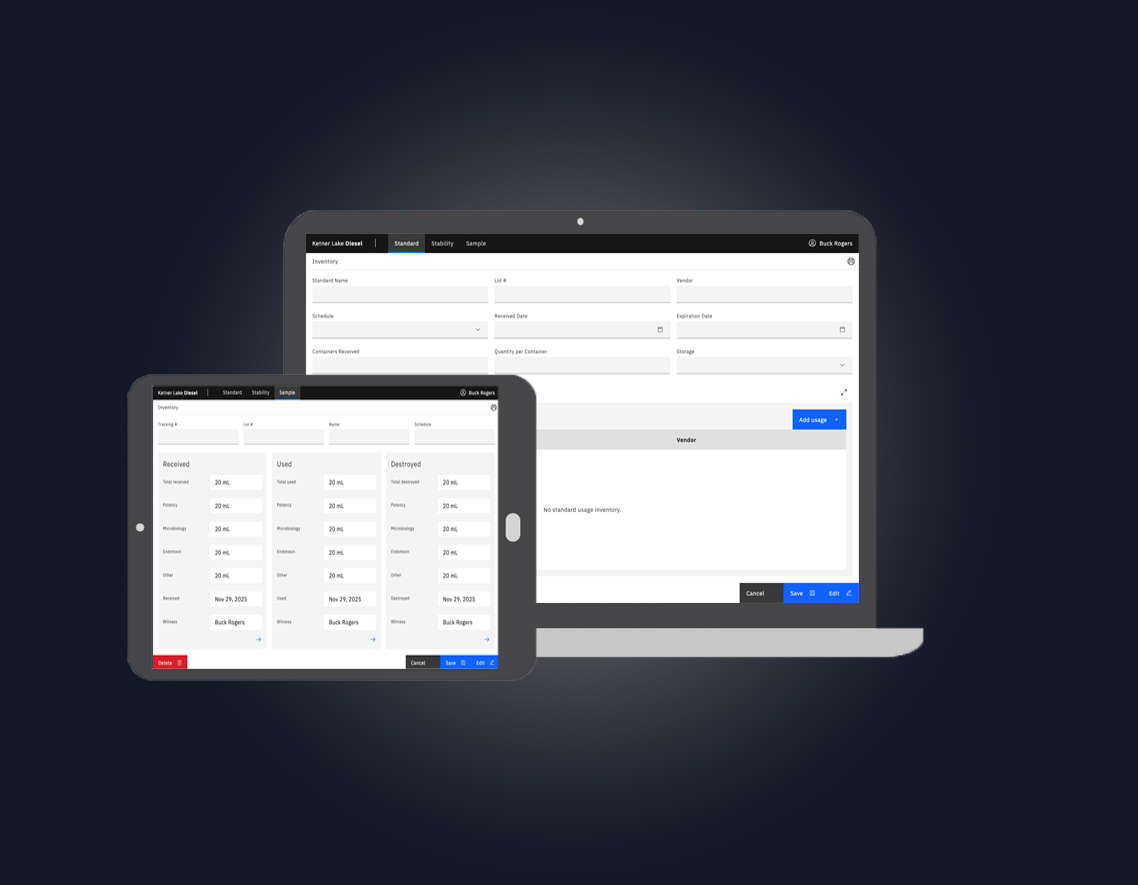
Built for a pharmacuetical company to digitally track and manage controlled substances. Replaced a paper-based workflow to mitigate risk and improve accountability and efficiency. Roles-based features.
Have a project, collaboration, or opportunity you would like to discuss? I am especially interested in work involving web architecture, data, IoT, and developer experience.
Prefer email? You can reach me at kevin@ketnerlake.com.