
Apr 1, 2026
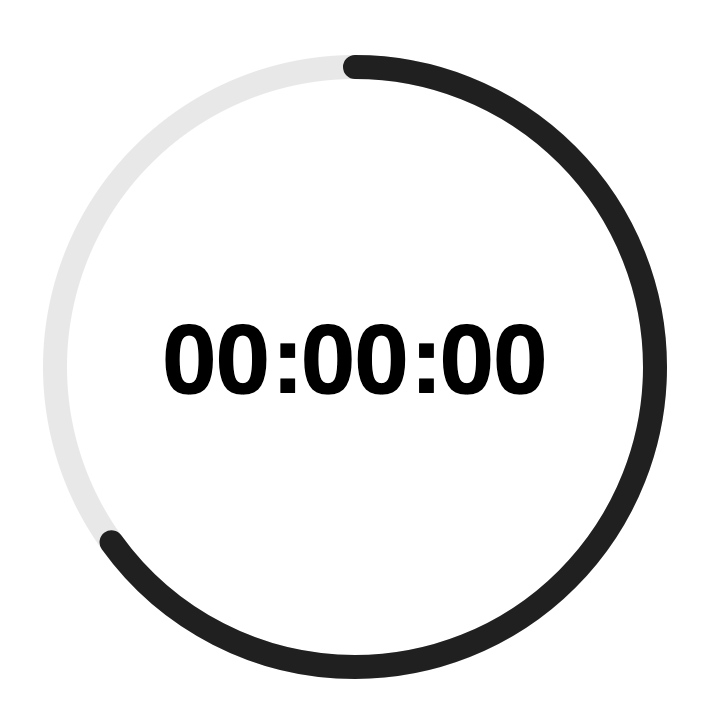
Given that you often want to label an SVG chart, you can set alignment-baseline and text-anchor on a text element to get fine-grained control. Setting both to middle will make the anchor the center of the element. Useful to adjust on charts with spokes such as radar.
<svg height="320" width="320">

  <!-- Track -->
  <circle
    cx="160"
    cy="160"
    fill="none"
    r="150"
    stroke="#1a1a1a1a"
    stroke-width="12" />

  <!-- Line -->
  <!-- Dash array === Circumference === 2 * Math.PI * Radius -->
  <!-- Dash offset === Circumference * ( 1 - Progress ) -->
  <!-- Transform (not CSS) puts start at noon -->
  <circle
    cx="160"
    cy="160"
    fill="none"
    r="150"
    stroke-dasharray="943"
    stroke-dashoffset="330"
    stroke="#1a1a1a"
    stroke-linecap="round"
    stroke-width="12"
    transform="rotate( -90 160 160 )" />

  <!-- Label -->
  <text
    x="50%"
    y="50%"
    alignment-baseline="middle"
    text-anchor="middle">
    00:00:00
  </text>

</svg>